Data Analyst Resume Keywords: What Actually Gets You Interviews in 2026
The data analyst resume keywords that matter most in 2026 fall into three groups: technical tools (SQL, Python, Excel, Tableau, Power BI), analytical methods (data cleaning, statistical analysis, data visualization), and business terms that connect your work to outcomes (KPIs, stakeholder reporting, revenue impact). The keywords alone won't get you hired, but missing the ones in the posting gets you filtered out before a human reads your resume.
Key takeaway
- The keywords that get screened for cluster into three groups: technical tools, analytical methods, and business-impact language. Cover all three, not just the tools.
- Pull keywords from the specific posting you're applying to, because ATS matching runs per-posting and generic top-ten lists overlap with everyone else's resume.
- In Resumatic builds, the keywords data analysts leave off most often are the ones you wouldn't expect: SQL, Python, and Tableau, in one way or another, were missed.
What are the most important data analyst resume keywords?
Recruiters and the ATS both scan for the same thing first: evidence that you can do the core parts of the job. For a data analyst that means pulling data, cleaning it, analyzing it, and explaining it to someone who doesn't work in spreadsheets. The keywords below show up across most data analyst postings in 2026, grouped so you can check your resume against them quickly.
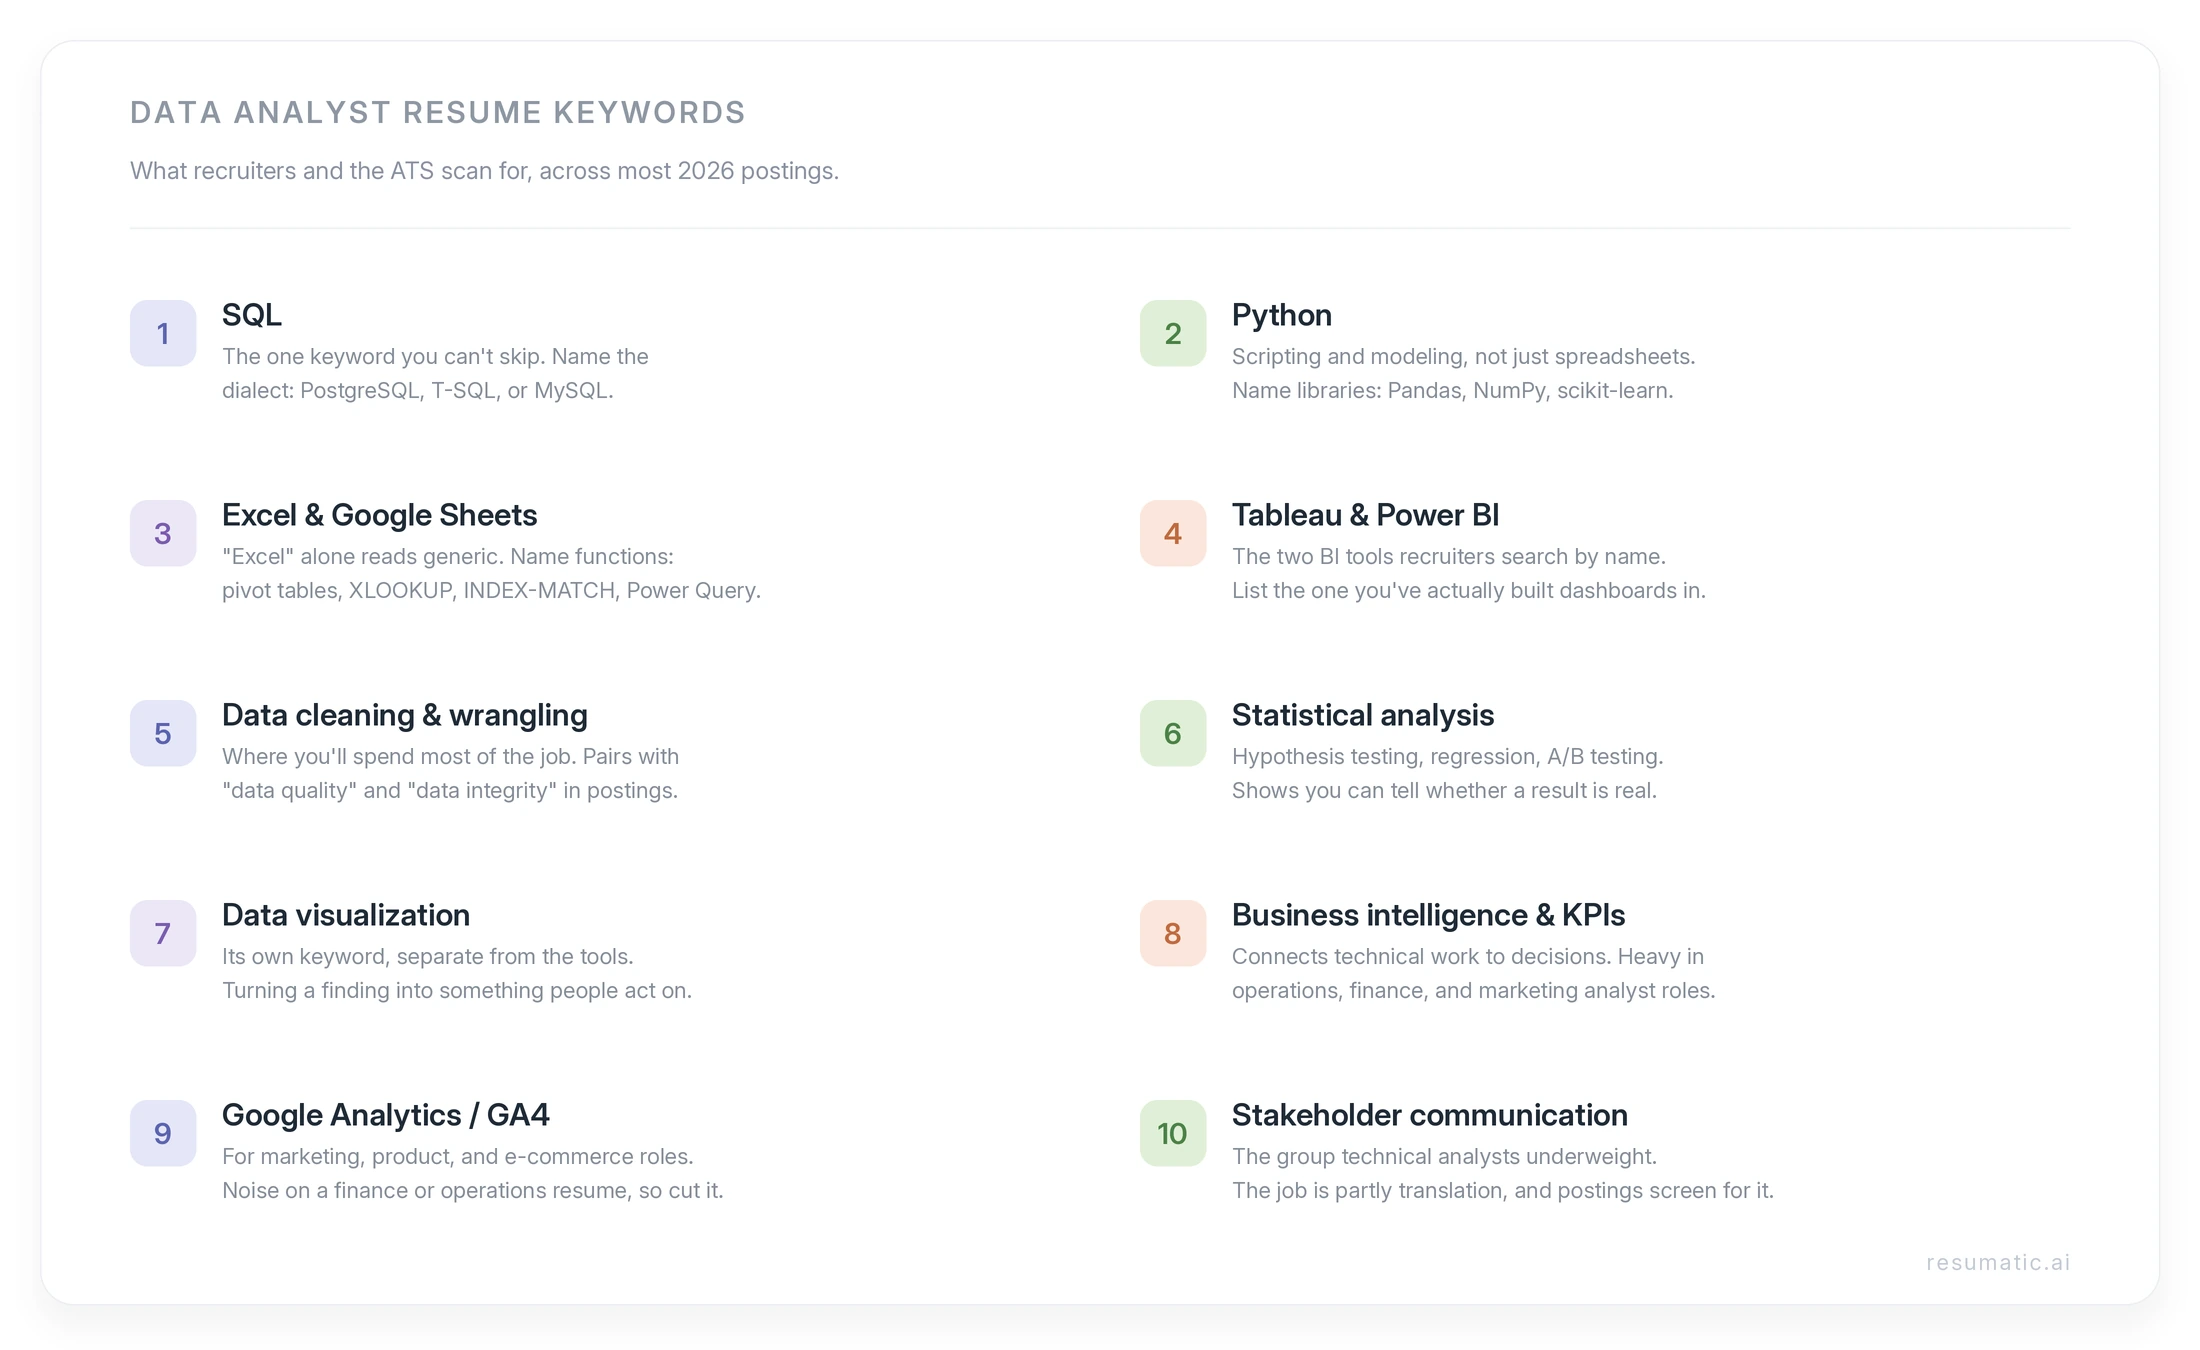
- SQL is the one keyword you can't skip. Name the dialect you actually use, whether that's PostgreSQL, T-SQL, or MySQL, because postings built on a specific database often screen for the specific term.
- Python signals you can go past spreadsheet analysis into scripting and modeling. Name the libraries you've used, since Pandas, NumPy, and scikit-learn show up as their own keywords in plenty of postings.
- Excel and Google Sheets still matter more than people expect. Pivot tables, VLOOKUP or XLOOKUP, INDEX-MATCH, and Power Query are the functions worth naming, because "Excel" on its own reads as generic.
- Tableau and Power BI are the two visualization and BI tools recruiters search for by name. List whichever you've actually built dashboards in, and don't pad the resume with both if you've only touched one.
- Data cleaning, data wrangling, and preprocessing describe the part of the job you'll spend most of your time on. Postings that mention "data quality" or "data integrity" are looking for this language.
- Statistical analysis covers hypothesis testing, regression, and A/B testing. These terms separate analysts who report numbers from analysts who can tell you whether a result is real.
- Data visualization is its own keyword, separate from the tools. It signals you can turn a finding into something a stakeholder will act on.
- Business intelligence and KPI reporting connect your technical work to decisions. Analyst roles inside operations, finance, or marketing lean on this language heavily.
- Google Analytics or GA4 belongs on the resume for marketing, product, and e-commerce analyst roles specifically. For a finance or operations analyst role it's noise, so leave it off.
- Stakeholder communication and reporting is the keyword group most technical analysts underweight. The job is partly translation, and postings increasingly screen for the ability to present to non-technical audiences.
Which keywords do data analyst applicants leave off most often?
Here's what the other guides ranking for this query can't tell you, because they don't have the data. We pulled over 1,000 data analyst resumes built in Resumatic between 2023 and 2026, and compared each user's draft against the job descriptions they pasted into the builder. The pattern was consistent enough to be worth flagging.
In some form or another, the keywords that analysts missed including on their resume included the ones you think they would have figured out. Keywords like "SQL" or "Python" were commonly missed in one way or another, either in the skills section or in the bullet points themselves. By far the most common one was including something like "SQL" in the skills section but failing to demonstrate it in the actual experience section - this happened in over 20% of cases.
The second pattern was about business language. Among users targeting senior analyst roles, over 50% had good tool coverage but almost no business impact — they failed to connect their work to the bigger picture.
The lesson isn't to add more keywords. It's that the keywords you already have don't count for much when they sit in a list with no evidence behind them.
How do you find the right keywords for a specific job posting?
Generic keyword lists, including the one above, are a starting point, not the answer. ATS keyword matching runs against the specific posting, so the keywords that matter are the ones in the job description in front of you. The process is faster than people assume.
Read the posting twice and mark every tool, method, and responsibility that repeats. Repetition is the signal. If a posting mentions SQL three times and dashboards twice, those are the terms the screen is weighted toward. Mirror the exact phrasing the posting uses, so if they write "data storytelling" rather than "data visualization," use their words, because the match is literal more often than it's semantic. Then map each keyword to a place on your resume where you can show it with a result, not just assert it. Anything you can't back with evidence either comes off the resume or moves to a brief skills line where it's honest about being a familiarity rather than a strength.
That last step is the one most applicants skip, and it's the difference between a resume that's stuffed and one that's tailored.
Where do the keywords belong, and how many is too many?
The honest answer to "how many keywords" is that the number isn't the problem. A resume with forty keywords in a skills grid and four vague bullets will lose to a resume with a dozen keywords woven into bullets that show outcomes. Keyword stuffing was a real tactic against older ATS software that counted term frequency. Most modern parsers read context, and every recruiter reads context, so a wall of terms with nothing behind it reads as padding and usually hurts.
Where the keywords go matters more than how many there are. The strongest placement is inside an accomplishment, because that's where a keyword carries proof. "Built SQL queries against a 10TB warehouse to cut reporting time by 30%" does more for both the ATS and the human than "SQL" sitting in a skills bar, even though both contain the keyword. A short skills section is still worth keeping for the tools you genuinely use, since some parsers and some recruiters scan it first, but it's a supporting cast, not the main event.
If you're choosing between naming a tool you've barely touched and leaving it off, leave it off. Getting screened in on a keyword you can't speak to in an interview is a worse outcome than not getting the keyword match in the first place.
Do technical keywords matter more than business keywords for data analysts?
For junior roles, technical keywords carry most of the weight, because the screen is checking whether you can do the mechanical work at all. As you move up, the balance shifts. Senior and lead analyst postings screen for business language and stakeholder communication as heavily as for tools, because at that level the job is less about running the query and more about deciding which question is worth asking and convincing someone to act on the answer. Loading a senior analyst resume with tool keywords and no business framing is one of the more common reasons experienced candidates stall at the screening stage.
Here's roughly how the emphasis shifts by level:
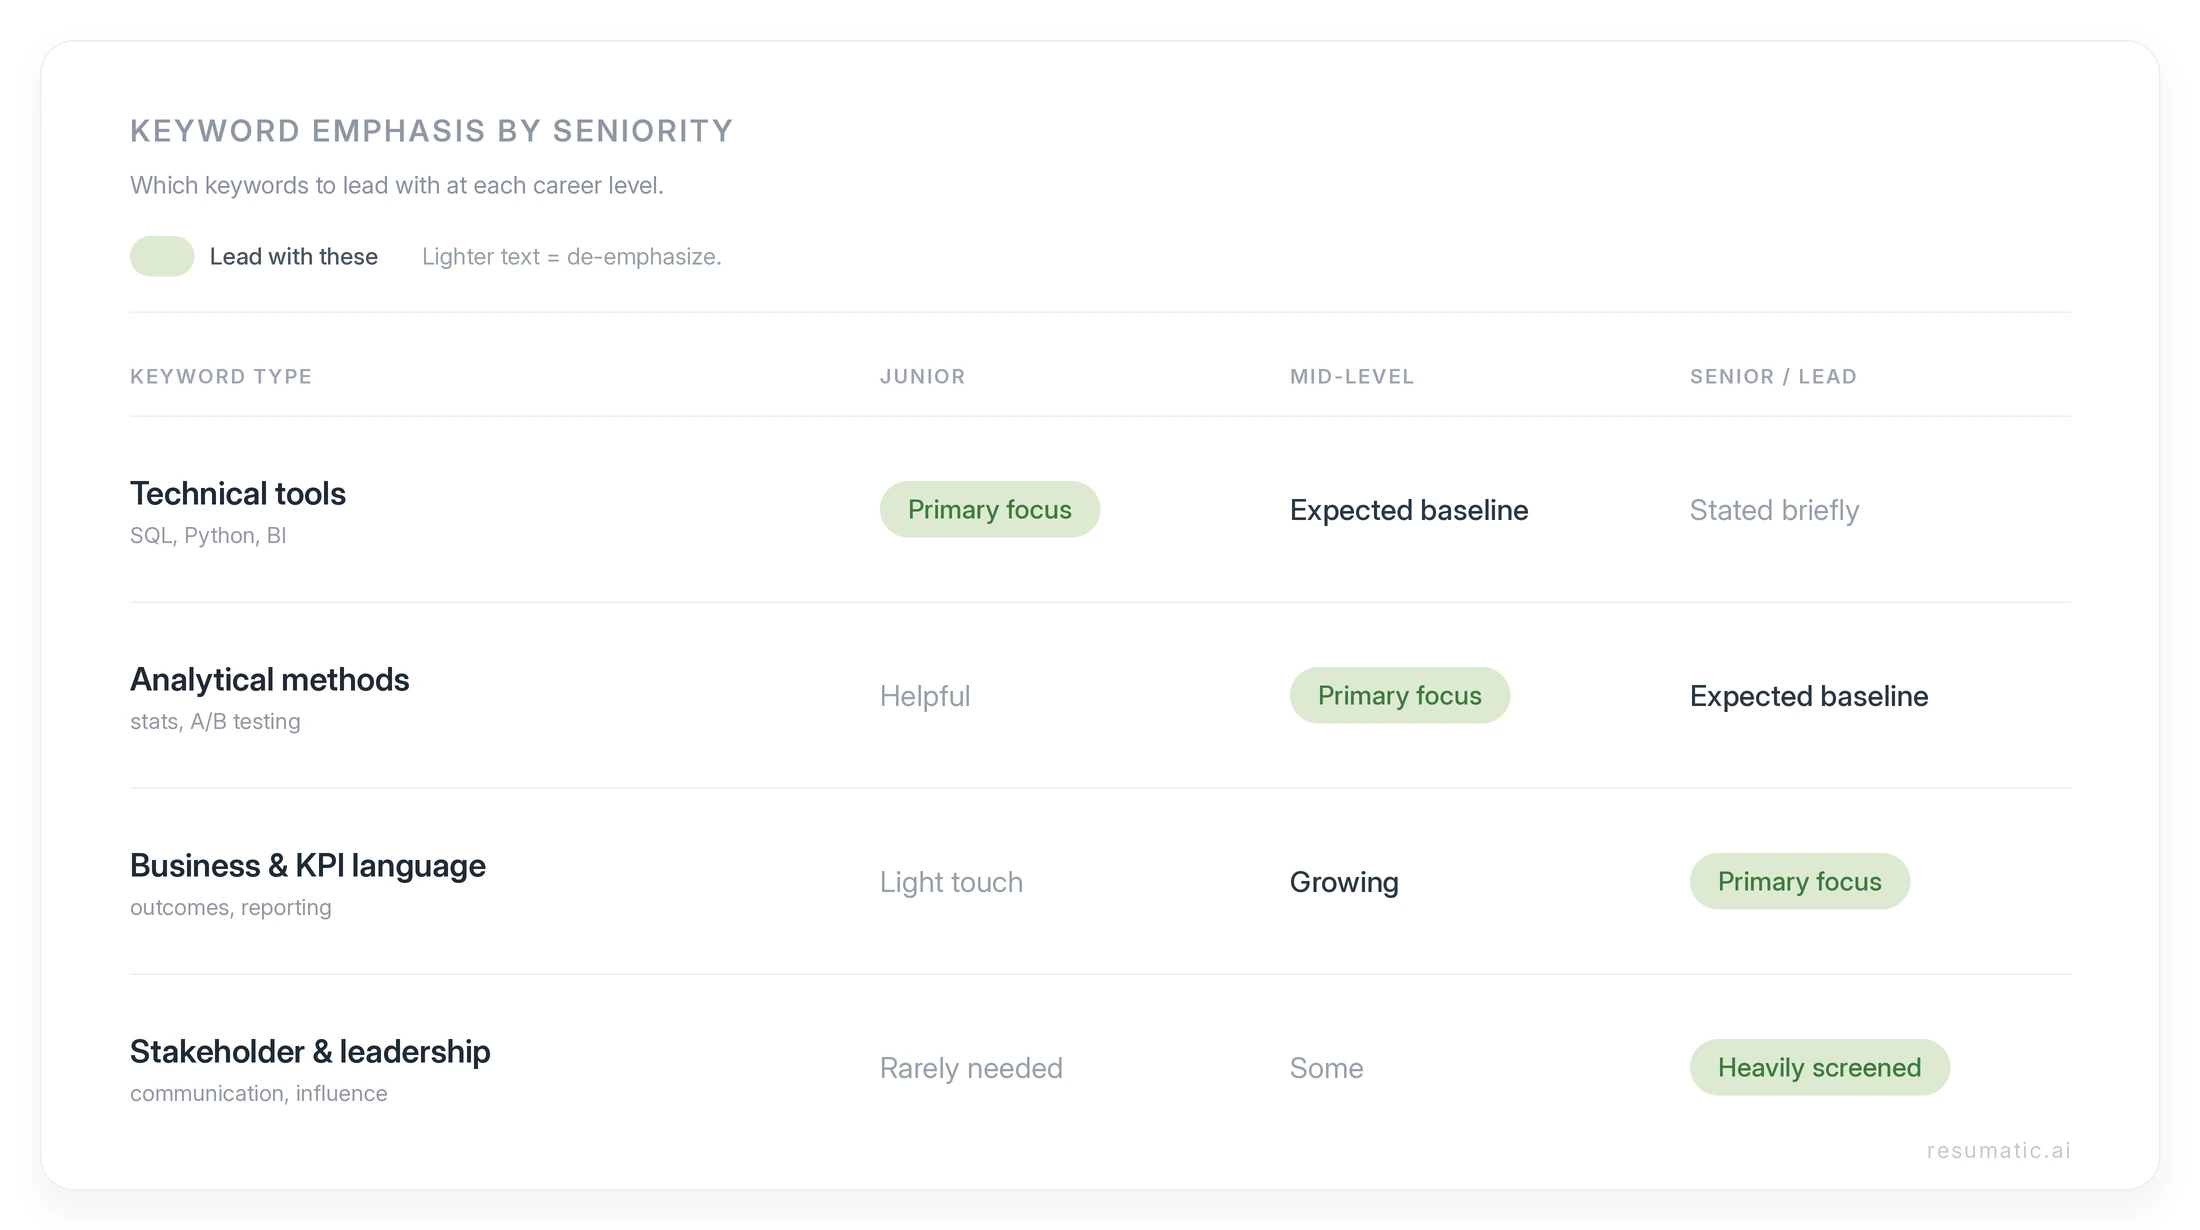
The keywords themselves don't change much between levels. What changes is which ones you lead with and how much evidence sits behind each.
Frequently asked questions
What keywords should I put on a data analyst resume in 2026?
Cover three groups: technical tools (SQL, Python, Excel, Tableau or Power BI), analytical methods (data cleaning, statistical analysis, A/B testing), and business-impact terms (KPI reporting, stakeholder communication). Then layer in the exact keywords from the specific posting you're applying to. The generic list gets you in range; the posting-specific terms are what the ATS actually matches against.
How many keywords is too many on a resume?
There's no fixed number, but a skills grid packed with thirty or more terms tends to backfire. Modern parsers and every recruiter read context, so keywords with no evidence behind them read as padding. A dozen keywords woven into bullets that show results will outperform a long undifferentiated list every time.
Do data analyst resume keywords need to match the job description exactly?
Often, yes. ATS matching is more literal than semantic, so if a posting says "data storytelling," using "data visualization" can miss the match. Mirror the posting's exact phrasing for tools and responsibilities where you honestly can. You don't need every term, but the ones that repeat across the posting are worth matching word for word.
Should I list keywords in a skills section or in my bullet points?
Both, but the weight belongs in your bullets. A keyword inside an accomplishment ("automated reporting in Python, saving ten hours a week") carries proof that a keyword in a skills bar doesn't. Keep a short skills section for the tools you genuinely use, since some parsers scan it first, but treat your bullets as the main event.
About the author
Alex Khamis, CPRW, is the cofounder of Resumatic and the founder of Final Draft Resumes. He moderates r/resumes (1.2M+ members) and has personally written or reviewed more than 1,200 resumes across technical and analytical roles since 2019. LinkedIn | About Resumatic
If you want to see which keywords your own draft is missing against a specific posting, Resumatic does that comparison for you, free to start. Paste the job description, paste your resume, and it flags the gaps in about a minute. It won't replace tailoring by hand, but it'll catch the terms you'd otherwise miss.
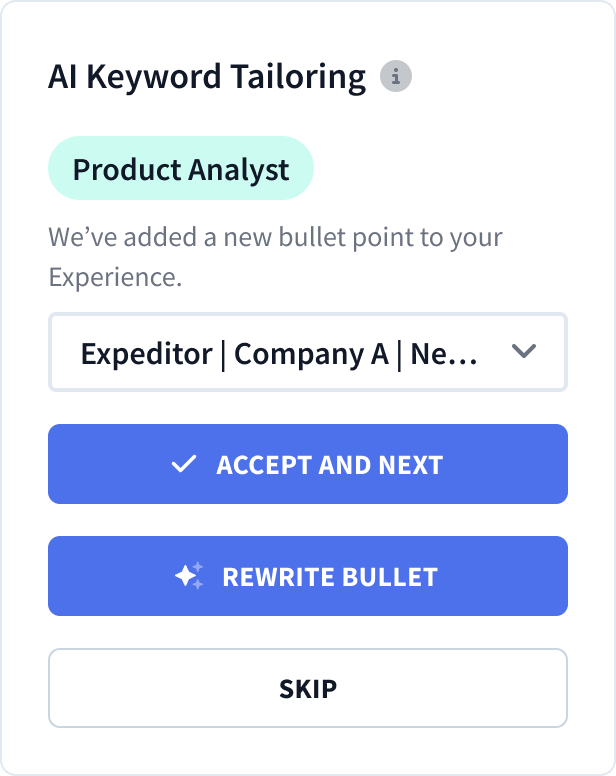
Automatic AI Resume Tailoring
Customize your resume with AI-guided precision.